


Jan 8, 2019 11:15 UTC
| Updated:
Jan 8, 2019 at 11:15 UTC
Ether Market Trends Show A Lot of Parallels With Bitcoin Price Low Of 2015
Ethereum, the second largest network by market cap has been on a meticulous rise lately, after the bearish trends in last quarter of 2018 made it loose its second spot to Ripple. However, the current price trends have an interesting pattern, where analysts have pointed its parallel with the bearish trends of Bitcoin in 2015.
Since, September 2018 the market price graph of Ether, the native crypto of Ethereum network has mimicked the same structure as that of Bitcoin towards the end of 2015. The term used for recurring market patterns is called fractals.
The crypto trade market is among the most volatile markets driven by the greed of whales, who uses schemes like pump & dump to drive the market in their favor. If the investors repeat their market behavior, the results cannot be that different, as being seen in case of Ether.
We will try to look into various aspects like similarities as well as differences between the market trends of Ether and Bitcoin in 2015.
The Similarities
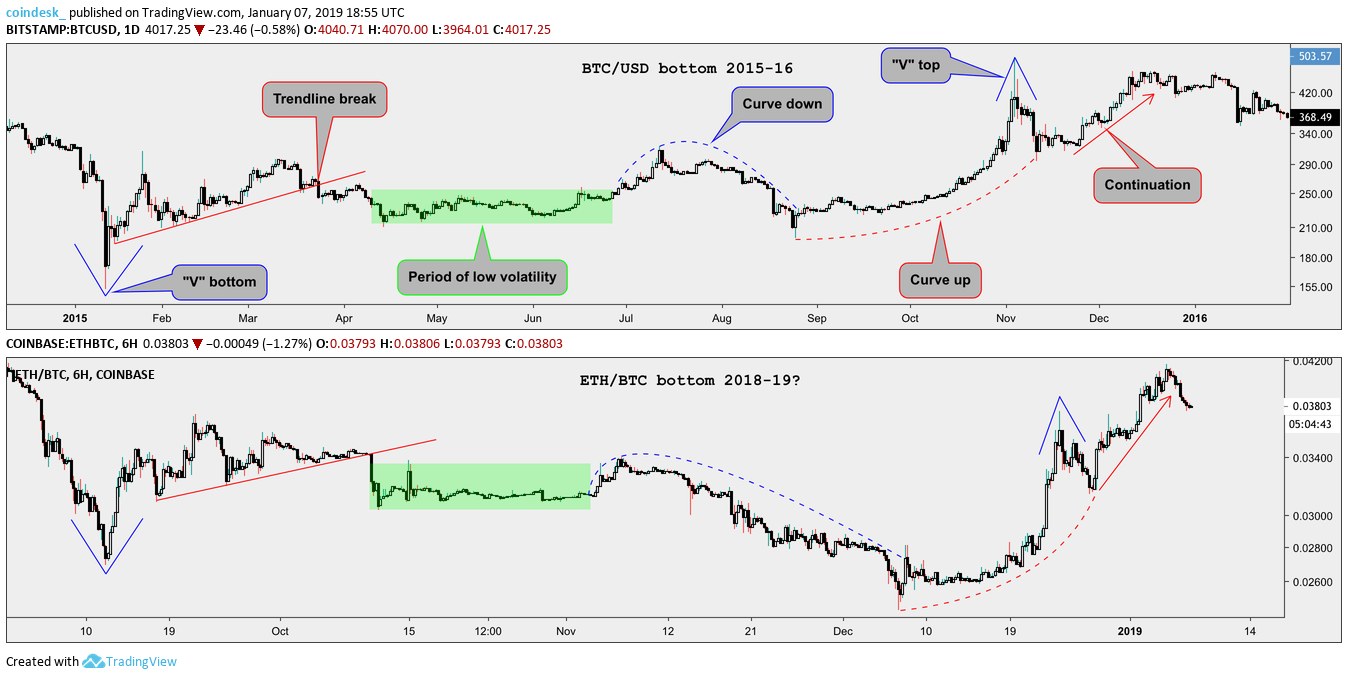
Looking at the comparison chart of the Ether price since Septemeber 2018 and Bitcoin Prices towards the end of 2015, we can see that the graphs look pretty similar. Apart from a few minor deviations, both the charts look exactly the same. (the chart at the top is that of Ether, while the bottom one signifies the market trend of Bitcoin.)
When we read the graph from left to right, it’s visible how both show a ‘V’ curve followed by a short rally of bearish trends. Once the bearish trend line gets over, both the tokens perform better than its peer and show less volatility, compared to the rest of the market.
Following the dull market trends for a certain period, both BTC and ETH shows a downward curve suggesting, big investors selling off their assets
Once the selling off period gets over, both the digital assets start an upward sharp rebound, forming another ‘V’ at the top, and continues to rise, giving an upper hand to the Bullish trends for a longer term than usual.
The Differences
After analyzing the similarities of the two, many of you might have been convinced that ETH is going to touch the new heights just like Bitcoin. However, it’s always the differences which play the spoil-sport. So let us see what are the major differences between the market patterns of 2015 Bitcoin and current trends of Ether market.
According to a stock market legend, the price of the market is driven by the law of ‘Cause & Effect’
In the case of BTC in 2015 the bearish trends aka cause continued for almost one year before the Bulls took charge taking the prices to all-time highs. However the cause behind the ETH is merely a few months old, so going by the theory, its effect on the bullish trend would be short-lived as well.
The time difference between the two ‘causes’ might be the key point here, however it does not take anything away from ETH. A bullish trend based on the ‘Cause & Effect’ theory is definitely on the cards, but not as long or as high as that of Bitcoin.
Conclusion
The parallels between the BTC and ETH price market is uncanny and as we discussed different similarities and differences, the effect of the similarities can be beneficiary, but at the same time people should not overshoot their expectation from a price-point view, as the crypto markets volatility is highly dependent on its PR buzz and people’s interest.
People need to understand that a small term price gain should never be the goal, as it is not good for the long-run of the asset. People should rather focus on reducing the volatility factor, be it on the market or through the development process.

Prashant Jha
As a content writer Prashant believes in presenting complex topics in simple laymen terms. He is a tech enthusiast and an avid reader.