


Mar 6, 2019 14:42 UTC
| Updated:
Mar 6, 2019 at 14:42 UTC
Ripple (XRP) Price Analysis – Ripple Trading In Ascending Price Channel As Bulls Battle To Climb Higher
Ripple has seen a price increase totalling 2.30% over the past 24 hours of trading, bringing the current trading price up to around $0.32090, at the time of writing. Ripple has now seen a small 7.64% price decline over the past 90 trading days.
The cryptocurrency is ranked in 3rd position as it presently holds a $13 billion market cap valuation. The 67 month old project now trades at a value that is 91% lower than the all time high price.
Let us take a look at Ripple over the recent period and highlight some potential areas of support and resistance moving forward.
Ripple Price Analysis
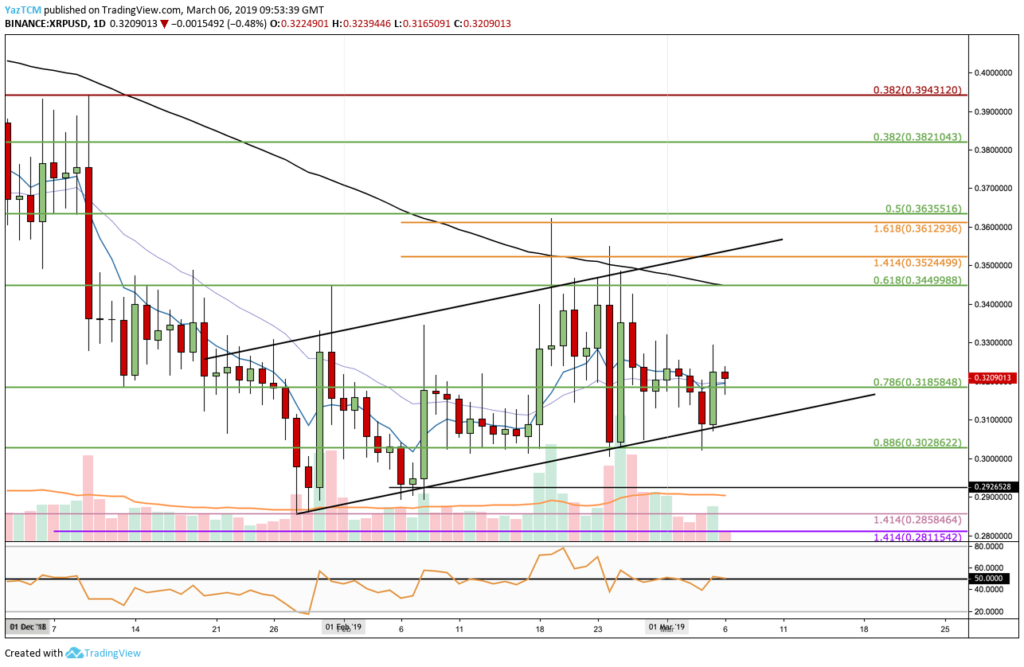
XRP/USD – DAILY CHART – MEDIUM TERM
What Has Been Going On?
Taking a look at the XRP/USD market above on the daily chart, we can see that the market has largely been trading sideways during the month of February as price action oscillated between $0.28 and $0.35.
We can also see that XRP/USD has been trading within the boundaries of a very wide ascending price channel. XRP has recently rebounded from the lower boundary as the market now heads higher once again.
Price action is now trading above support at the .786 Fibonacci Retracement level (drawn in green) priced at $0.3185.
What Is The Current Trend?
The current short term trend for Ripple is neutral. For this market to be considered bullish, we would need to see price action rise and break above the resistance at the $0.35 level. IF price action was to break below the lower boundary of the price channel, it would be considered bearish.
Where Can We Go From Here?
If the buyers continue to drive XRP/USD higher from $0.32, we can expect immediate resistance above to be located at the $0.33 and $0.34 levels. This is followed with higher resistance at the .618 Fibonacci Retracement level (drawn in green) priced at $0.3449.
If the bullish momentum continues to drive price action above $0.35 for XRP/USD, we can then expect higher resistance to be located at the short term 1.414 and 1.618 Fibonacci Extension levels (drawn in orange) priced at $0.3542 and $0.3612, respectively. This is immediately followed with resistance at the .5 Fibonacci Retracement level (drawn in green) priced at $0.3635.
Alternatively, if the sellers regroup and begin to push XRP/USD lower we can expect immediate support below to be located at the .786 Fibonacci Retracement level (drawn in green) priced at $0.3185. Support below this is then expected at the lower boundary of the ascending price channel.
If the bears push the market below the price channel, we can expect further support below this to be located at the .886 Fibonacci Retracement level (drawn in green) priced at $0.3028.
What Are The Technical Indicators Showing?
The RSI is trading along the 50 level which indicates the indecision within the market. For price action to rise we would need to see the RSI rise and break above the 50 level.

Yaz Sheikh
Yaz is a cryptocurrency technical analyst with over 7 years of technical trading experience. As an Economics graduate, he has taken a keen interest in the future potentials of blockchain in the financial industry. Removing crypto from the equation, Yaz loves to watch his favourite football team and keep up-to-date with the latest fights within the UFC.