


Mar 5, 2019 10:10 UTC
| Updated:
Mar 5, 2019 at 10:10 UTC
Ethereum (ETH) Price Analysis – Ethereum Breaks Back Above $130 – Bulls Aiming For $150 Next?
Ethereum has seen a small rebound over the past 24 hours, totalling 1.57%, bringing price action back above $130 to $131.58, at the time of writing. Despite the 6% price drop over the past 7 trading days, the market is still up by a total of 20% over the past 30 trading days.
Ethereum is now ranked in 2nd position as the coin currently holds a $13.66 billion market cap value. The 43-month-old project is now trading at a value that is 90% lower than its all-time high price.
Let us take a look at Ethereum over the recent period and highlight some potential areas of support and resistance moving forward.
Ethereum Price Analysis
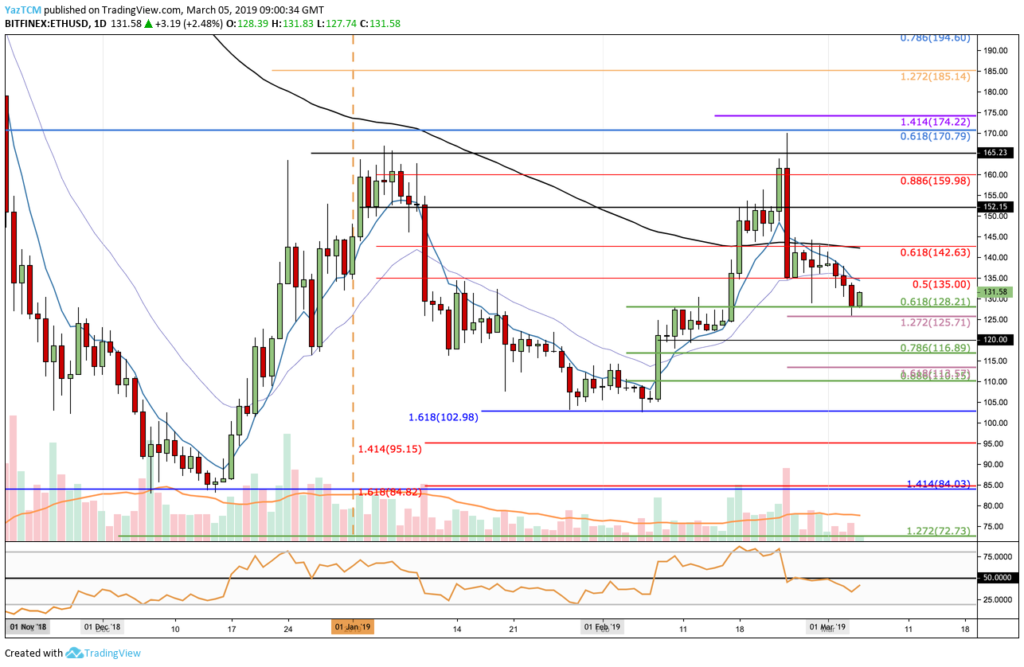
ETH/USD – DAILY CHART – MEDIUM TERM
What Has Been Going On?
Analysing the market from the daily chart above, we can see that Ethereum had bounced from its 2018 bearish trend toward the end of December 2018 as the market had reached support at a downside 1.414 Fibonacci Extension level (drawn in blue) priced at $84.
After rebounding from this level of support the market went on to rally to a high around $165 during January 2019. The market then went on to fall during January 2019 until support was met at a short term downside 1.618 Fibonacci Extension level (drawn in blue) priced at $103.
During February 2019, Ethereum went on to rally again but failed to overcome the resistance at the $165 handle once again and has reversed. We can see that, during March 2019, price action has fallen slightly and is now trading at the support provided by the short term 0.618 Fibonacci Retracement level (drawn in green) priced at $128.21.
What Is The Current Trend?
The current short term trend is neutral. For this market to be considered bullish, we will need to see ETH/USD break above the resistance at $165. If Ethereum was to break below the $128 level, we could consider this market as bearish.
Where Can We Go From Here?
If the bulls can hold the support at the short term 0.618 Fibonacci Retracement level (drawn in green) priced at $128.21 and continue to climb higher, we can expect higher resistance above to be located at the bearish 0.5 and 0.618 Fibonacci Retracement levels (drawn in red) priced at $135 and $142, respectively.
Further resistance toward the upside is then expected at the $152, $160 and $165 levels.
Alternatively, if the sellers regroup and continue to push the market below the support at $128.21, we can expect immediate support below to be located at the short term 1.272 Fibonacci Extension level (drawn in lilac) priced at $125.71.
If the sellers continue to drop the market beneath $125, more support is then expected at the 0.786 and 0.886 Fibonacci Retracement levels (drawn in green) priced at $117 and $110, respectively.
What Are The Technical Indicators Showing?
The RSI has recently slipped beneath the 50 handle which indicates that the sellers have taken control of the market momentum. For a sign that the selling pressure is fading, we will look for the RSI to head back toward the 50 level.

Yaz Sheikh
Yaz is a cryptocurrency technical analyst with over 7 years of technical trading experience. As an Economics graduate, he has taken a keen interest in the future potentials of blockchain in the financial industry. Removing crypto from the equation, Yaz loves to watch his favourite football team and keep up-to-date with the latest fights within the UFC.