


May 14, 2018 04:57 UTC
| Updated:
Dec 7, 2018 at 08:03 UTC
Technical Analysis of Ethereum: An expectation of recovery against USD
After a major decline, Ethereum (ETH) price has shown a positive movement in the market. It is recovering against US Dollar and Bitcoin. In the past week, it was held at $635 support zone against USD and was traded for as low as $637.88. Then, it started an upside movement
Highlights:
- Movement of Ethereum above the $710 resistance against the US Dollar.
- On the hourly chart of ETH/USD (data feed via Kraken), a key bullish trend line with support at $710 forming is apparent.
Since then, it has been climbing higher and has pushed the price back above the $700-705 resistance and the 100 hourly simple moving average. These all are positive signs. However, it must not be ignored that there are many supports on the downside near the $705-710 zone. On the hourly chart of ETH/USD (data feed via Kraken), a key bullish trend line with support at $710 forming is apparent.
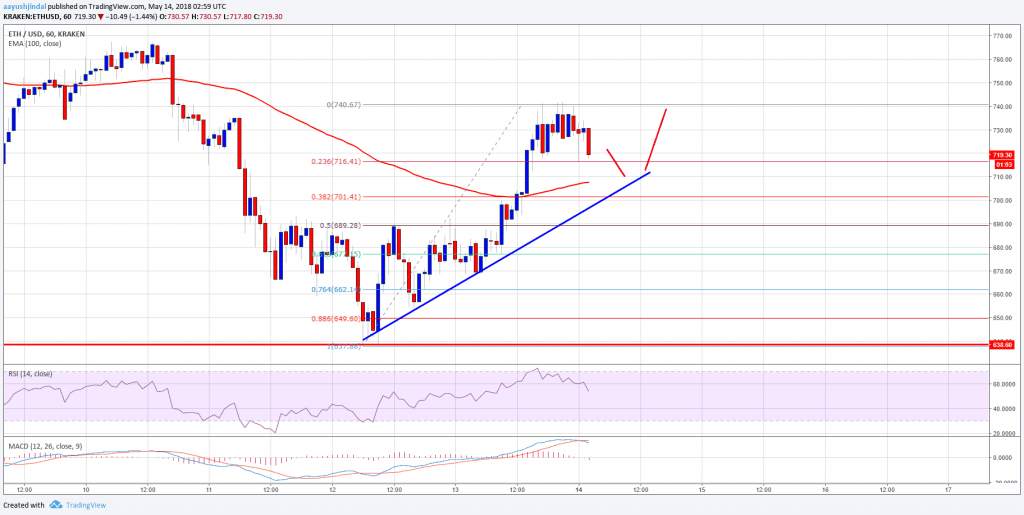
Looking at the chart, the price remains supported on the downside above $702. As long as the price is above $700 and the 100 hourly SMA, the possibility of recovery is intact.
Hourly MACD – The movement of MACD is slow in the bearish zone.
Hourly RSI – The RSI is moving lower towards the 50 level.
Major Support Level – $705
Major Resistance Level – $740

Raghav Sawhney
Raghav is a significant contributer who uses his knowledge, skills and experience towards development & growth of the organisation in an efficient and effective manner.